

 ログイン
ログイン


ライフプランやローンのことなど、お客さまのお悩みをお気軽にご相談ください。
令和6年能登半島地震に関するお知らせ
※最短で翌日に口座番号をお知らせします。
お役立ち情報
おすすめのキャンペーン情報やお客さまの生活に役立つサービスをご紹介します。
人気の商品・サービス
よくご利用されている商品・サービスをご紹介します。
キーワードでみつける

おかねの豆知識コラム
ライフイベントにあわせ、かしこくお金と付き合っていくための豆知識をご紹介します。
マイホームNEW
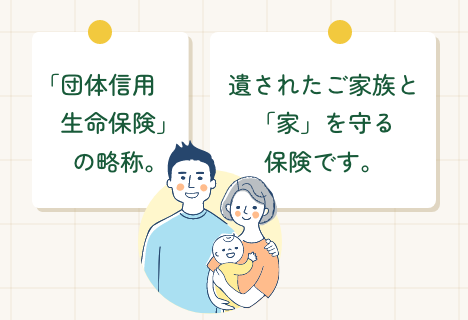
「だんしん」ってなんだろう?
公開日:2023/9/27
マイホーム
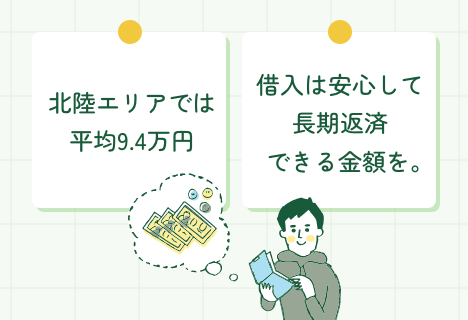
年収から考える住宅ローン借入適正額はいくら?住宅購入価格の推移も踏まえて考えよう
更新日:2023/8/14
マイホーム
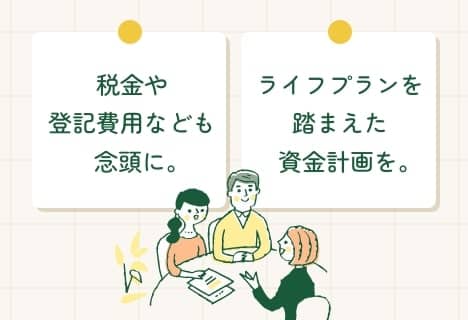
土地や家の購入時、費用や税金はいくらかかる?
更新日:2023/6/14
マイホーム
住宅ローン金利の選び方!ライフプランを踏まえた固定金利期間の選び方を解説
公開日:2022/11/11
テーマ別に探す
お知らせ
2024.4.19
- お知らせ

- NEW
北國銀行ハンドボール部 Honey Bee選手の引退について(166KB)
2024.4.17
- お知らせ
個人のお客さま向けポータルサイト「北國まるごと窓口ナビ」のサービス開設について(279KB)
2024.4.17
- お知らせ
笠市支店・金沢駅前支店の移転について(214KB)
2024.4.17
- お知らせ
粟田支店の移転について(193KB)
2024.4.11
- お知らせ
経営者セミナーの開催について(167KB)
2024.4.10
- お知らせ
「ハローキティ50周年記念コイン」の販売について(142KB)
2024.4.4
- お知らせ
株式会社北上製作所の銀行保証付私募債引き受けについて(143KB)

